04 · Ascent Integrated Tech · Product design
Helping incident commanders see who needs rehab
Ascent Integrated Tech makes a system that pairs sensors on firefighters’ helmets with wearables and feeds them into one dashboard, so incident commanders can track crews’ location, surroundings and health.
Overview
In 2023 six of us worked with Ascent as a university project on two questions: which health signals tell a commander a firefighter is ready to stay in, and how those signals should appear on screen. Our final deliverable was a set of high-fidelity screens. Ascent went on to ship a readiness feature.
The problem
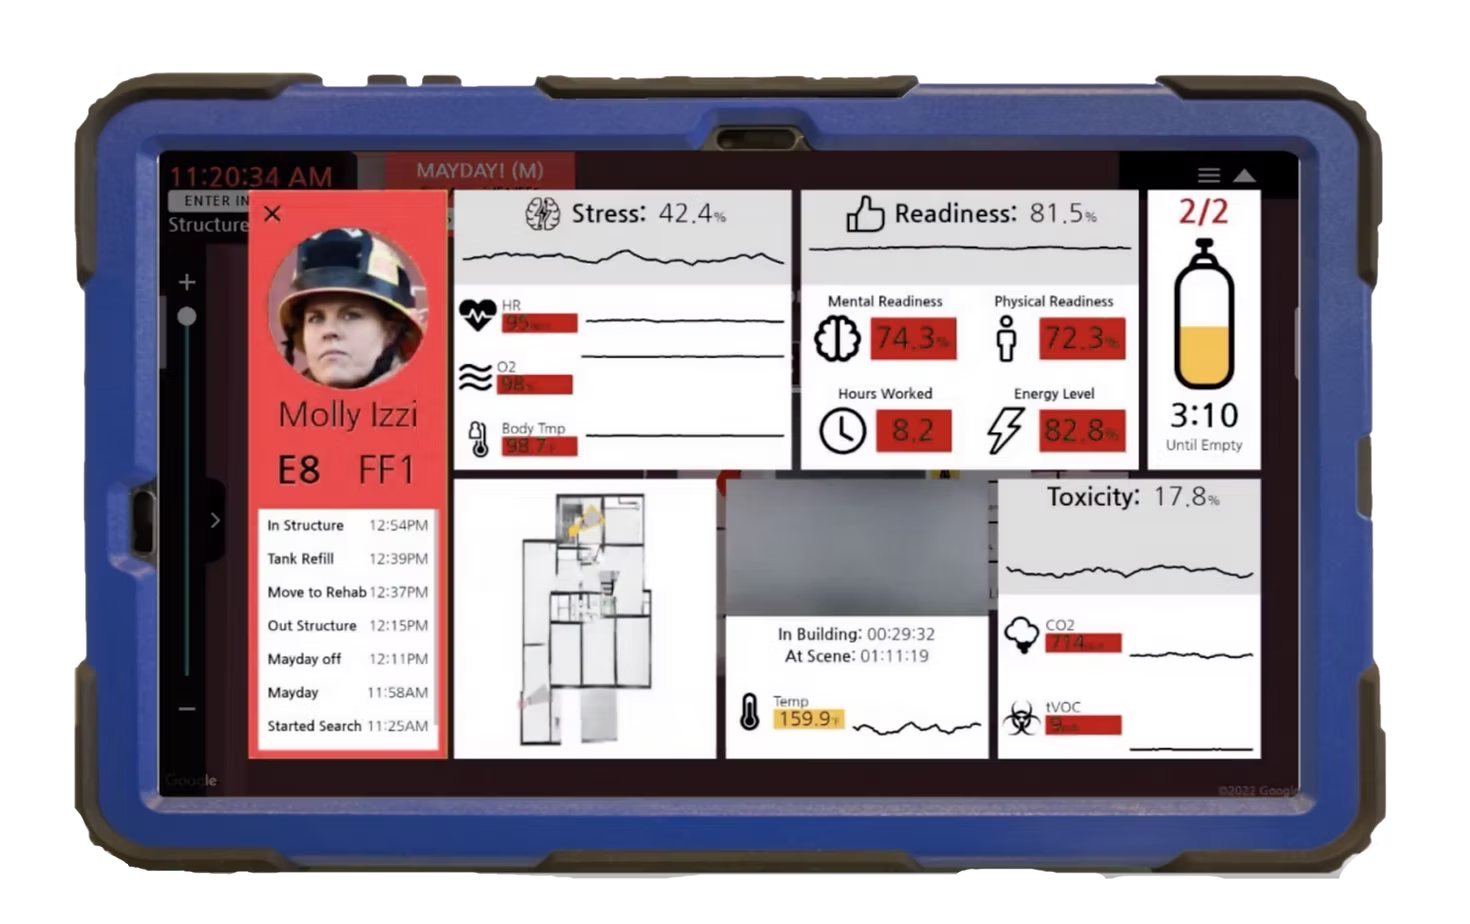
Commanders judged readiness from air tank levels, energy, previous shifts and word of mouth. A firefighter was checked after two 30-minute air tanks, at rehab, with a blood pressure cuff and a thermometer. Nothing told a commander during the incident that someone was getting worse, and a late call to send someone to rehab raises the risk for that firefighter.
Ascent’s own wireframes already tried to show this, but their survey found commanders went to the floor plan first and the screens were hard to read at a glance. A commander is also tracking crews, radio and hazards, so there is no time to read a screen of numbers. The problem became helping someone make a fast call, not showing more data.
How might the system show a commander who needs rehab, and why, without asking them to read a dashboard?
The process
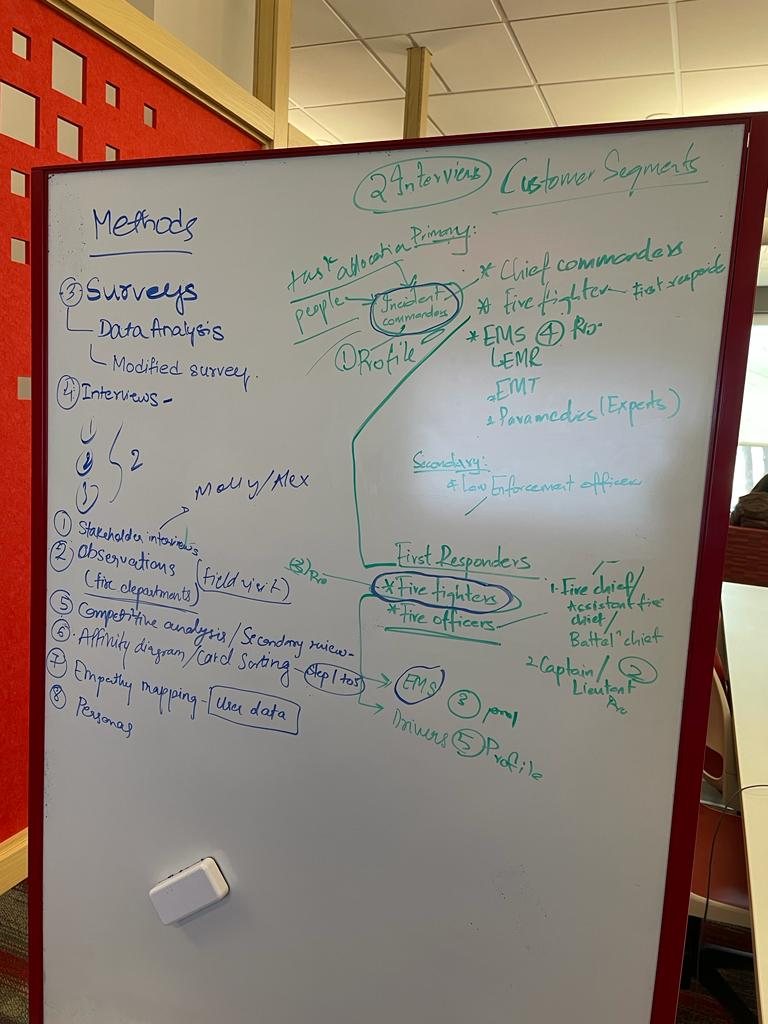
Two things shaped the plan. Approval to interview firefighters came late, so we started with subject matter experts, day-in-the-life videos and a literature review. And on their advice we narrowed the scope to structural fires, the most common kind firefighters attend.
Choosing the metrics
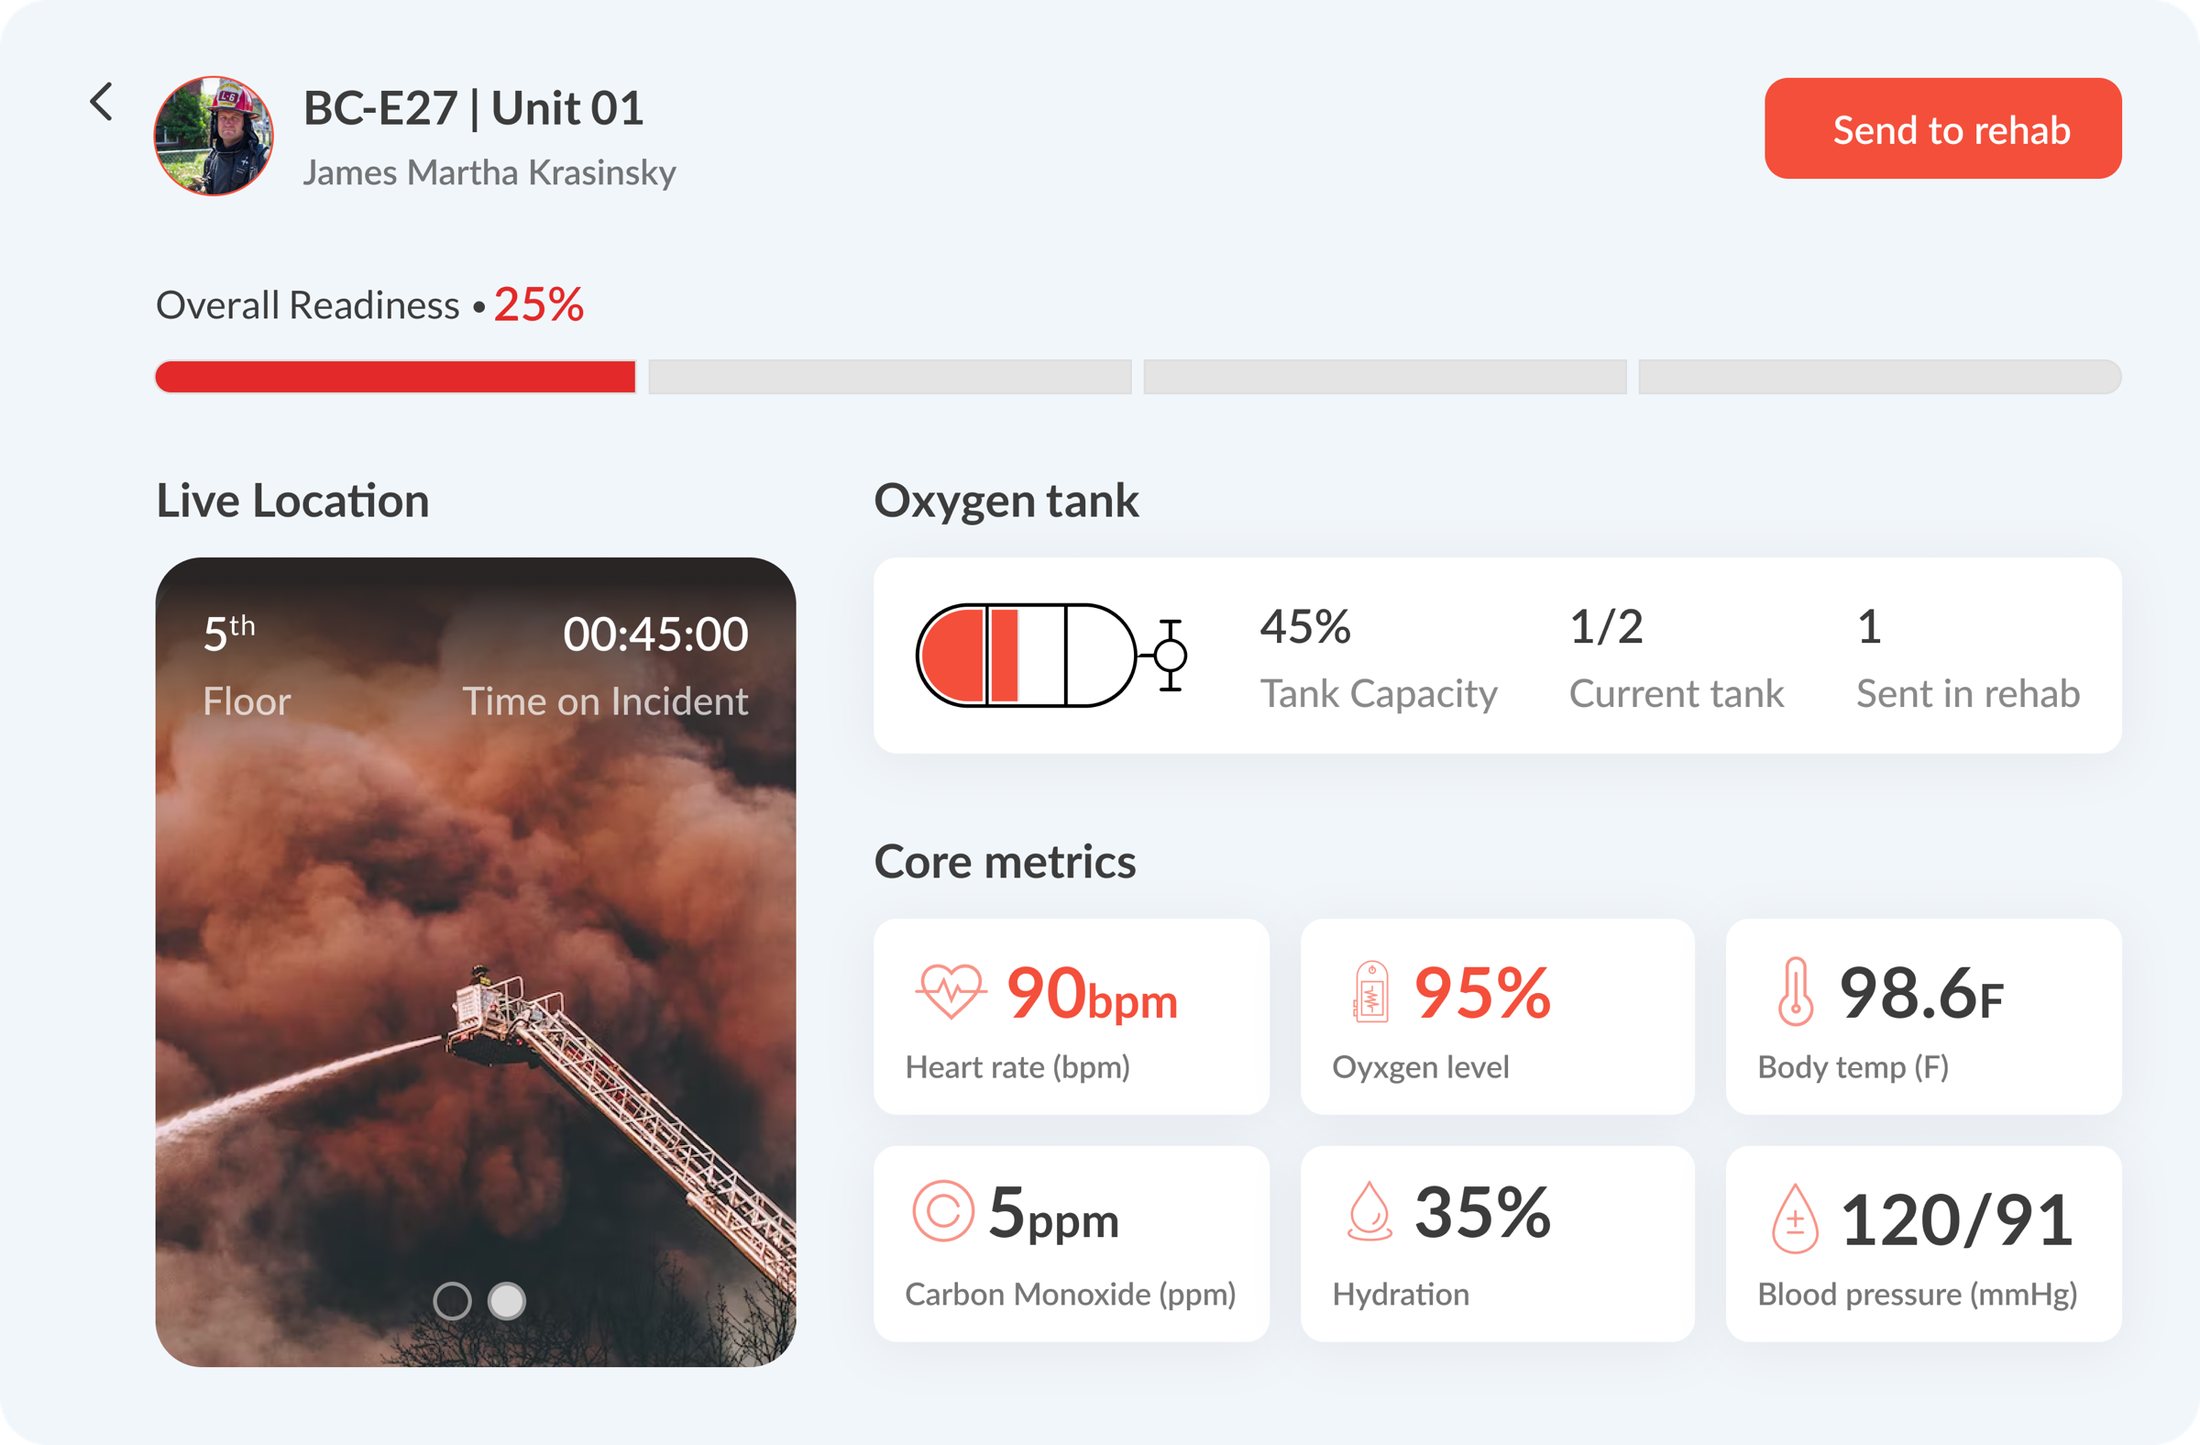
The literature review gave eleven candidate signals. Interviews with incident commanders cut them to seven: heart rate, oxygen level, core body temperature, carbon monoxide, hydration, blood pressure and air tank level.
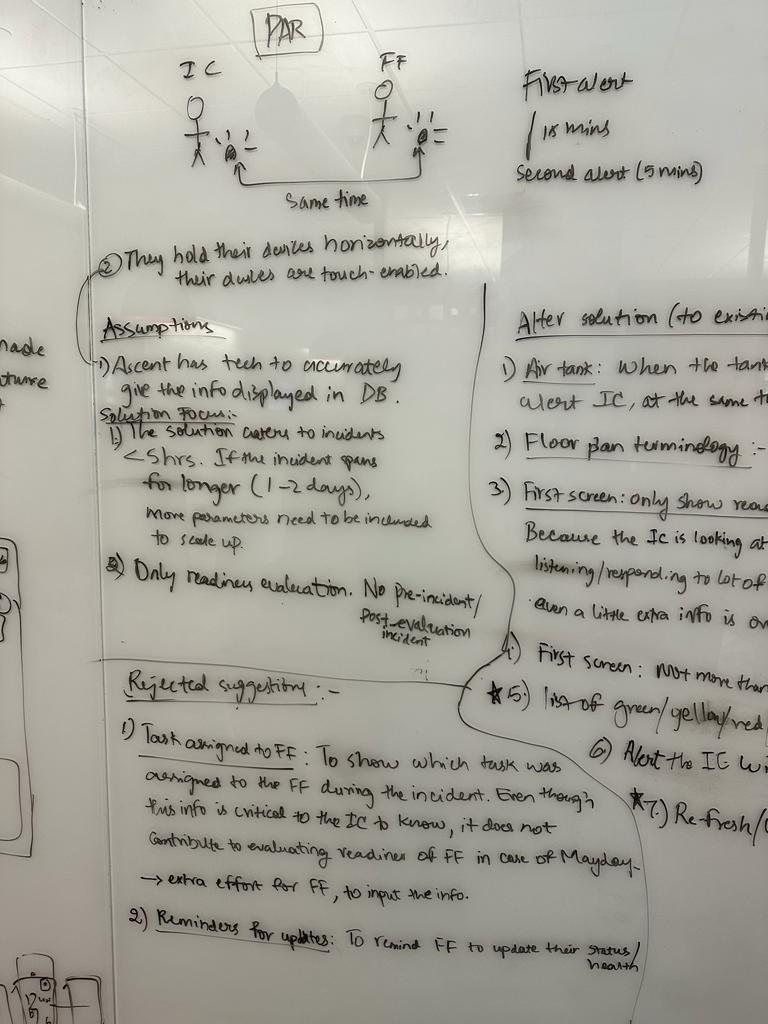
Readiness is only reported after two air tanks.
They want an alert when someone gets worse.
Planning still runs on pen, paper and the command board.
What commanders said about the first wireframes
Two incident commanders reviewed our wireframes in two rounds. I annotated the first with their comments. These are what the two decisions below respond to.
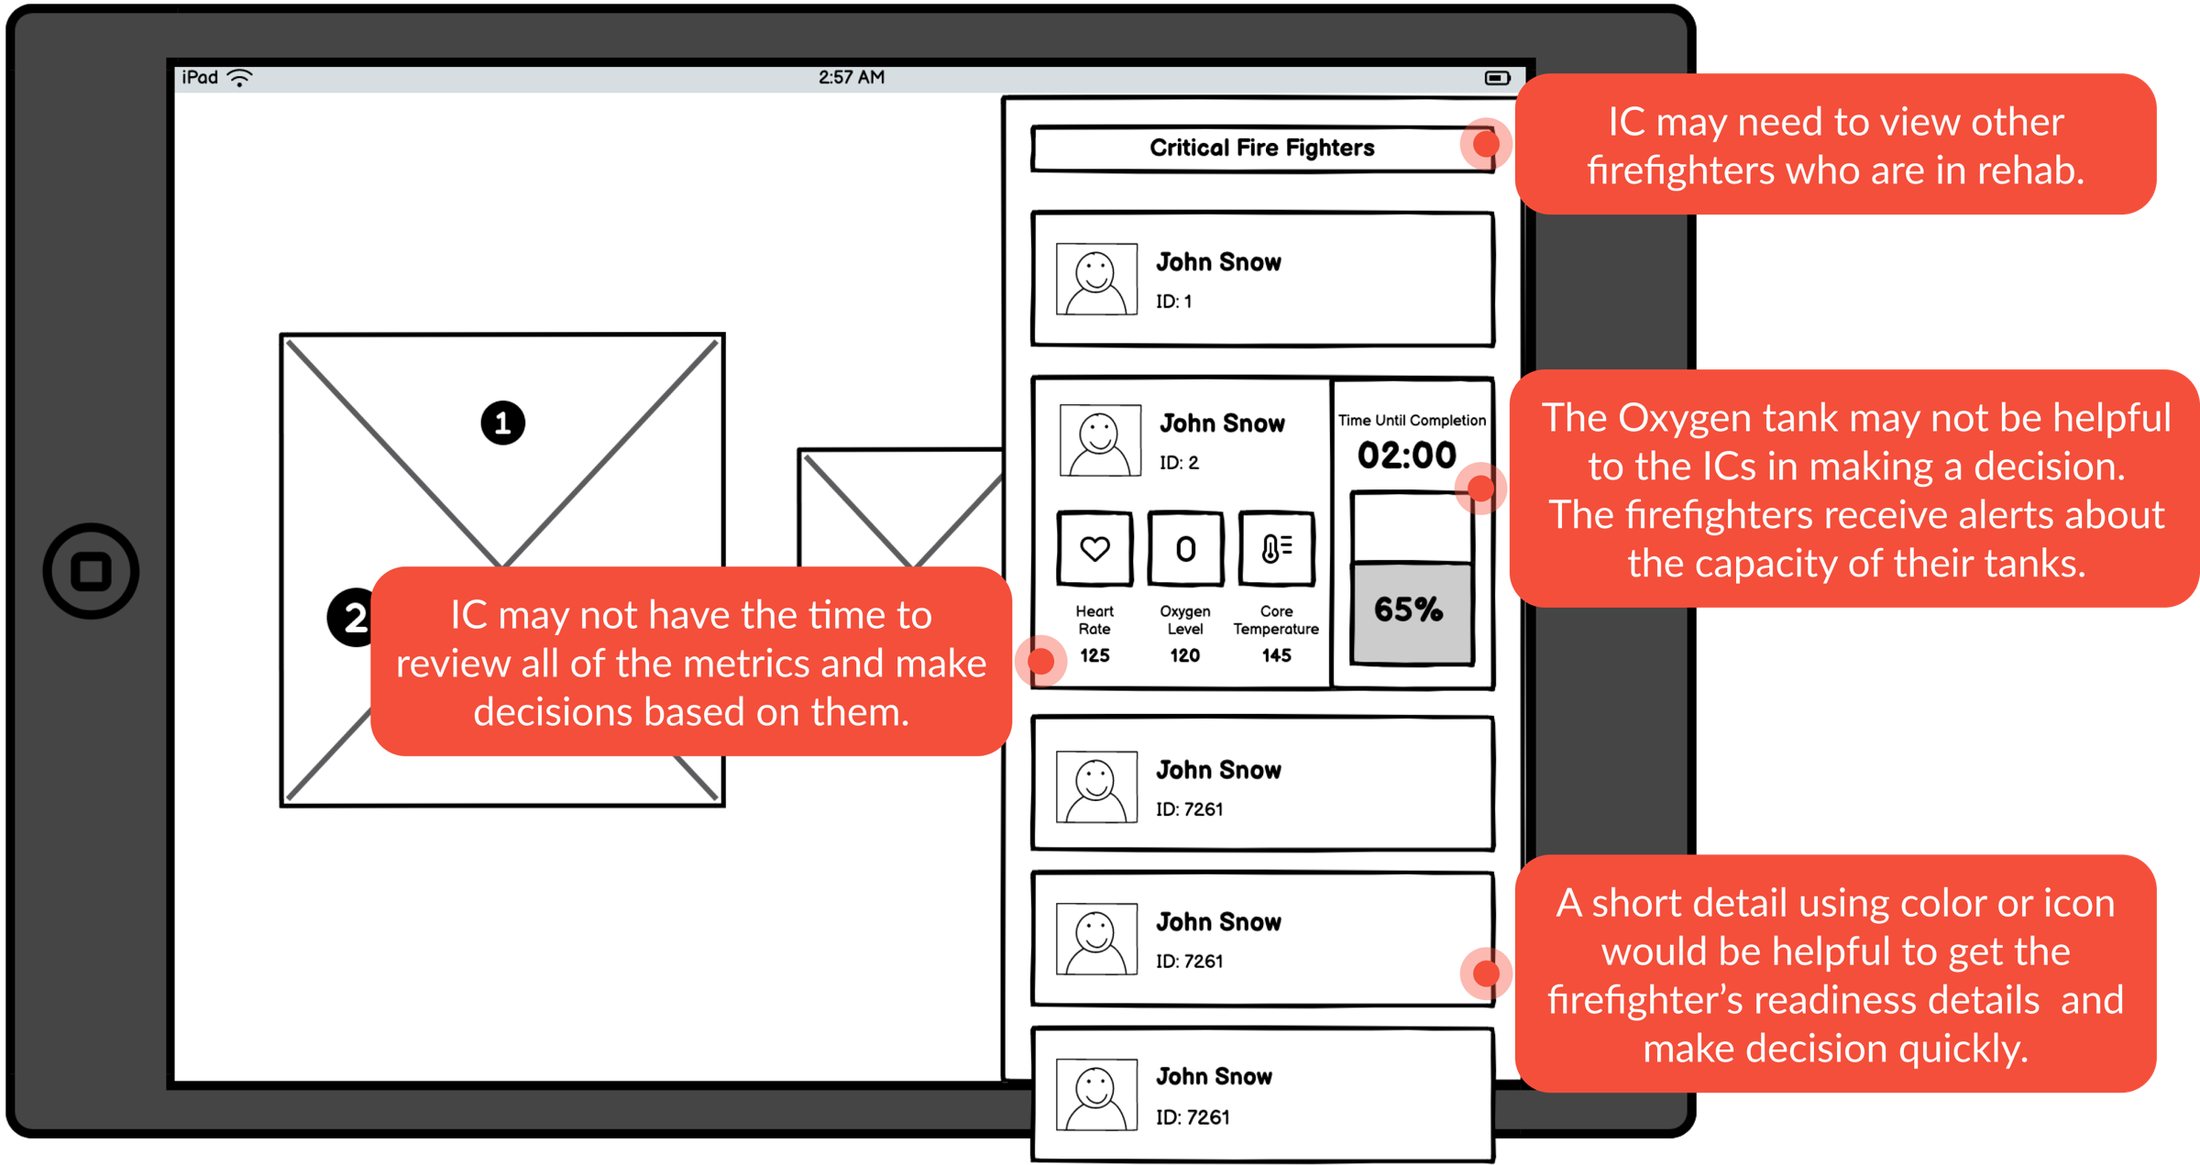
They would not have time to review every metric and decide from them.
They needed to see who is already in rehab.
A short colour or icon cue would show readiness quickly.
Design decisions
Two decisions came out of that. Both protect a commander’s attention.
Design the overview for triage
- The tension
Our first dashboard showed every metric we had found. Commanders said they would not have time to review them all and that the focus should be the core ones. A later round dropped electrolytes, shift changes and noise exposure.
- The decision
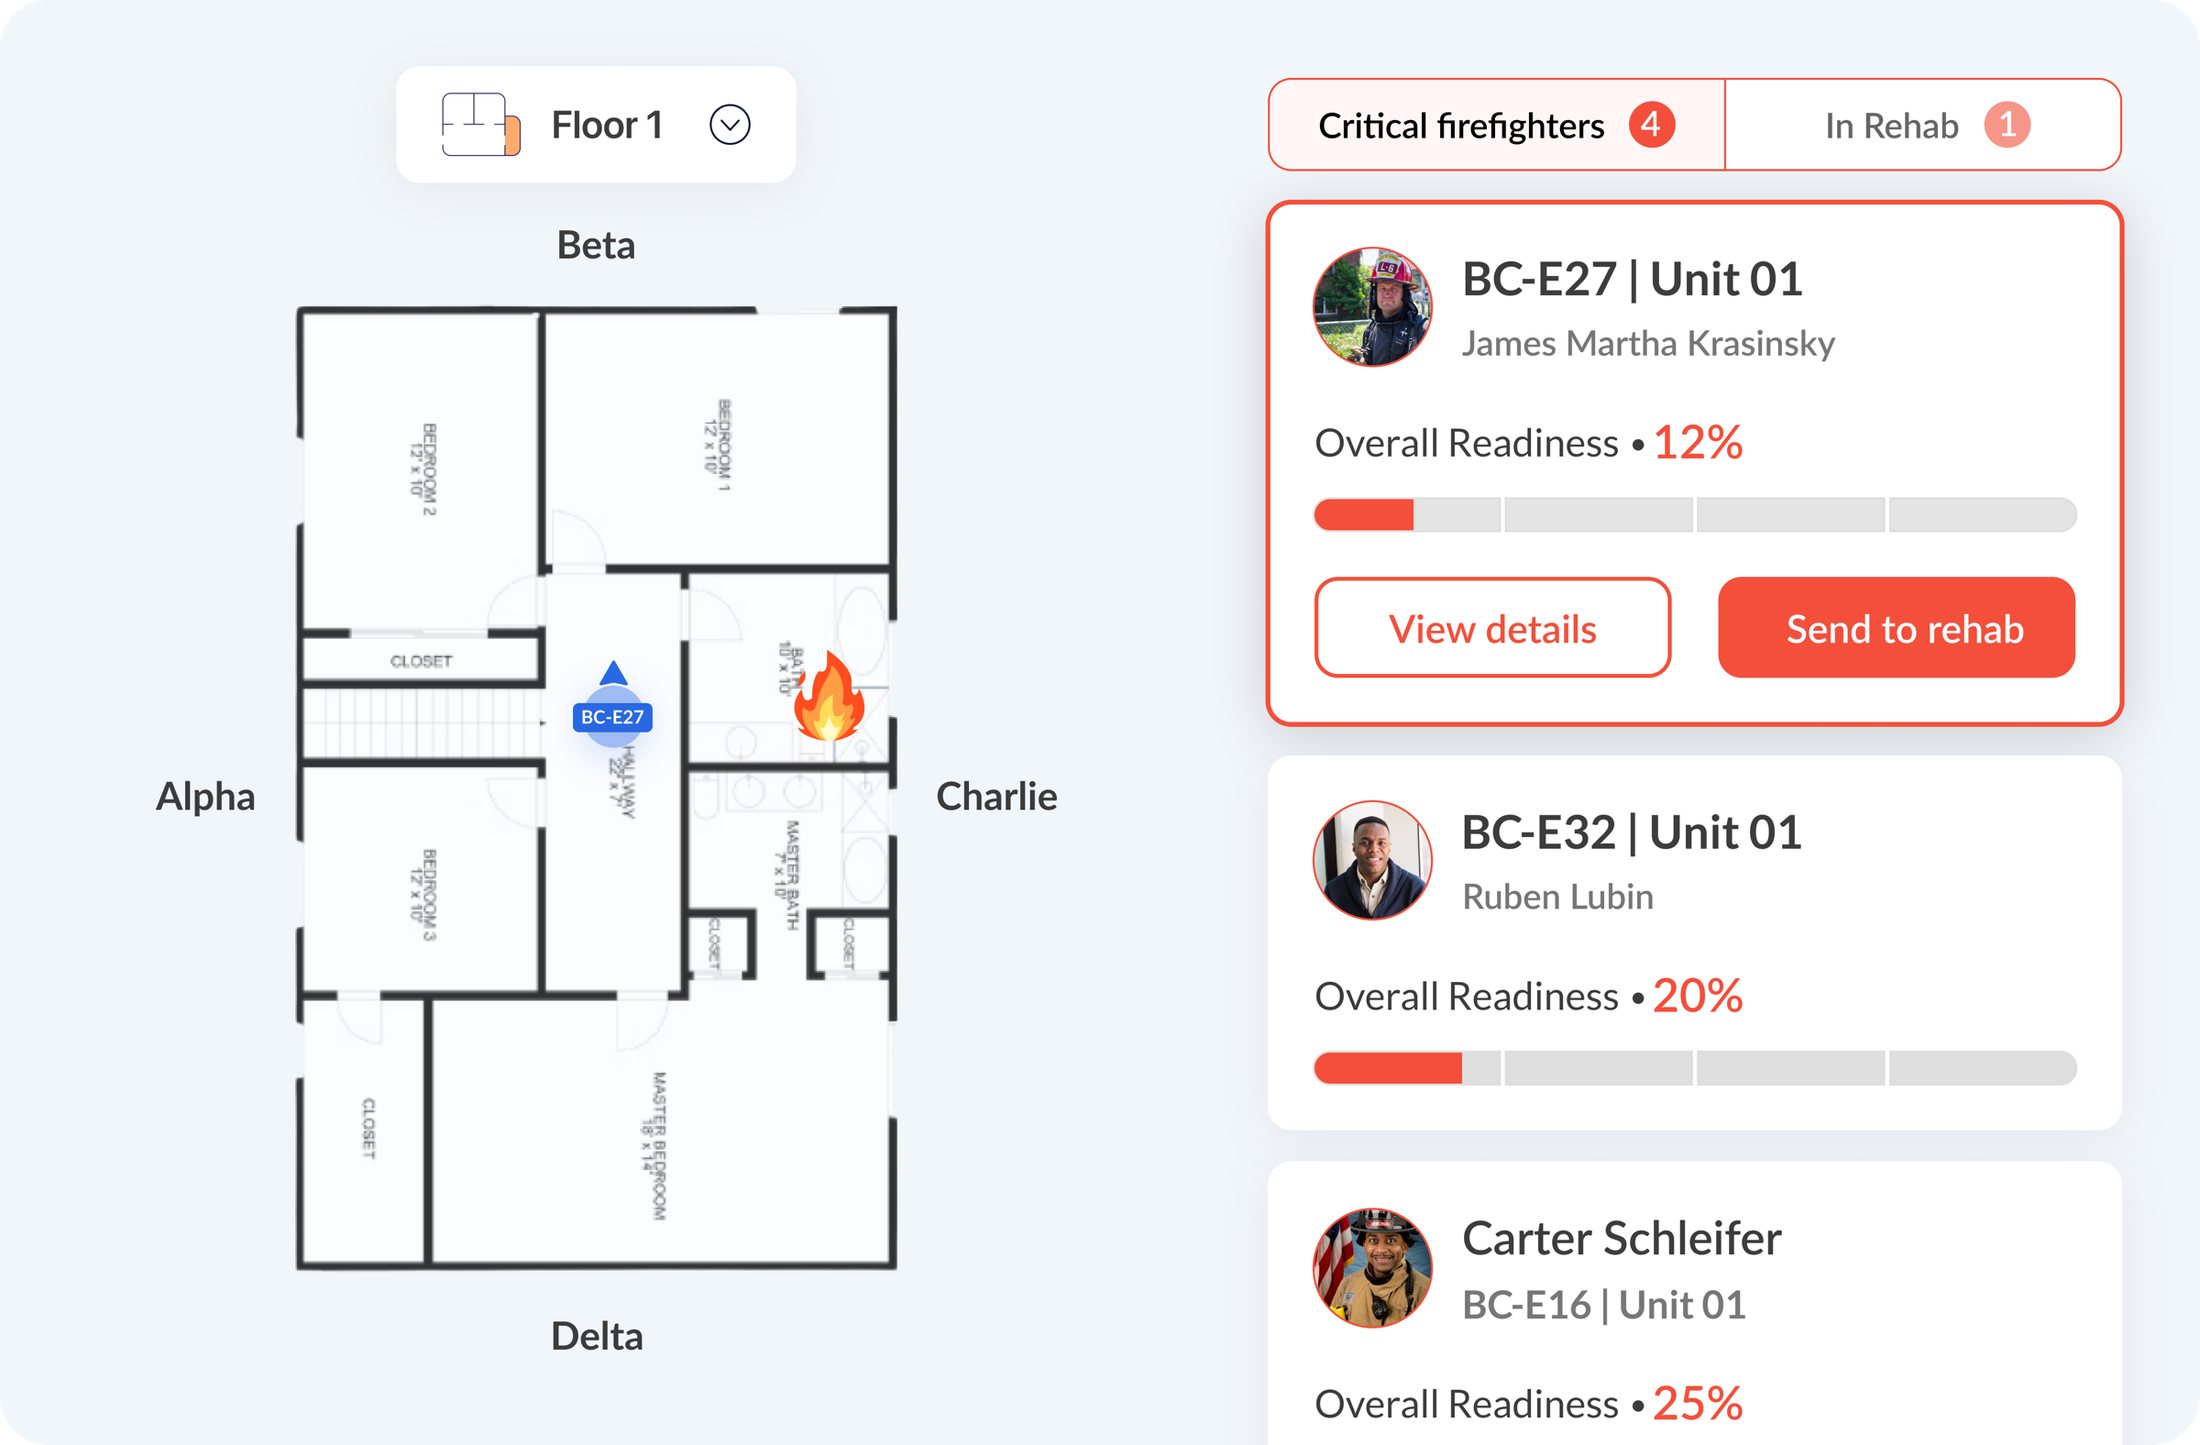
The overview leads with readiness, location and visible actions. Telemetry sits one step deeper, and readiness shows as a percentage as well as a colour.
- Why it matters
A commander can see who needs attention without analysing a dashboard first. The floor plan uses alpha, beta, charlie and delta, the words commanders already use.
Make rehab a workflow, not a label
- The tension
In the first wireframes the list showed only critical firefighters and the rehab action sat behind a detail view. Commanders said hidden actions would not work under pressure, and they wanted to see who was already in rehab.
- The decision
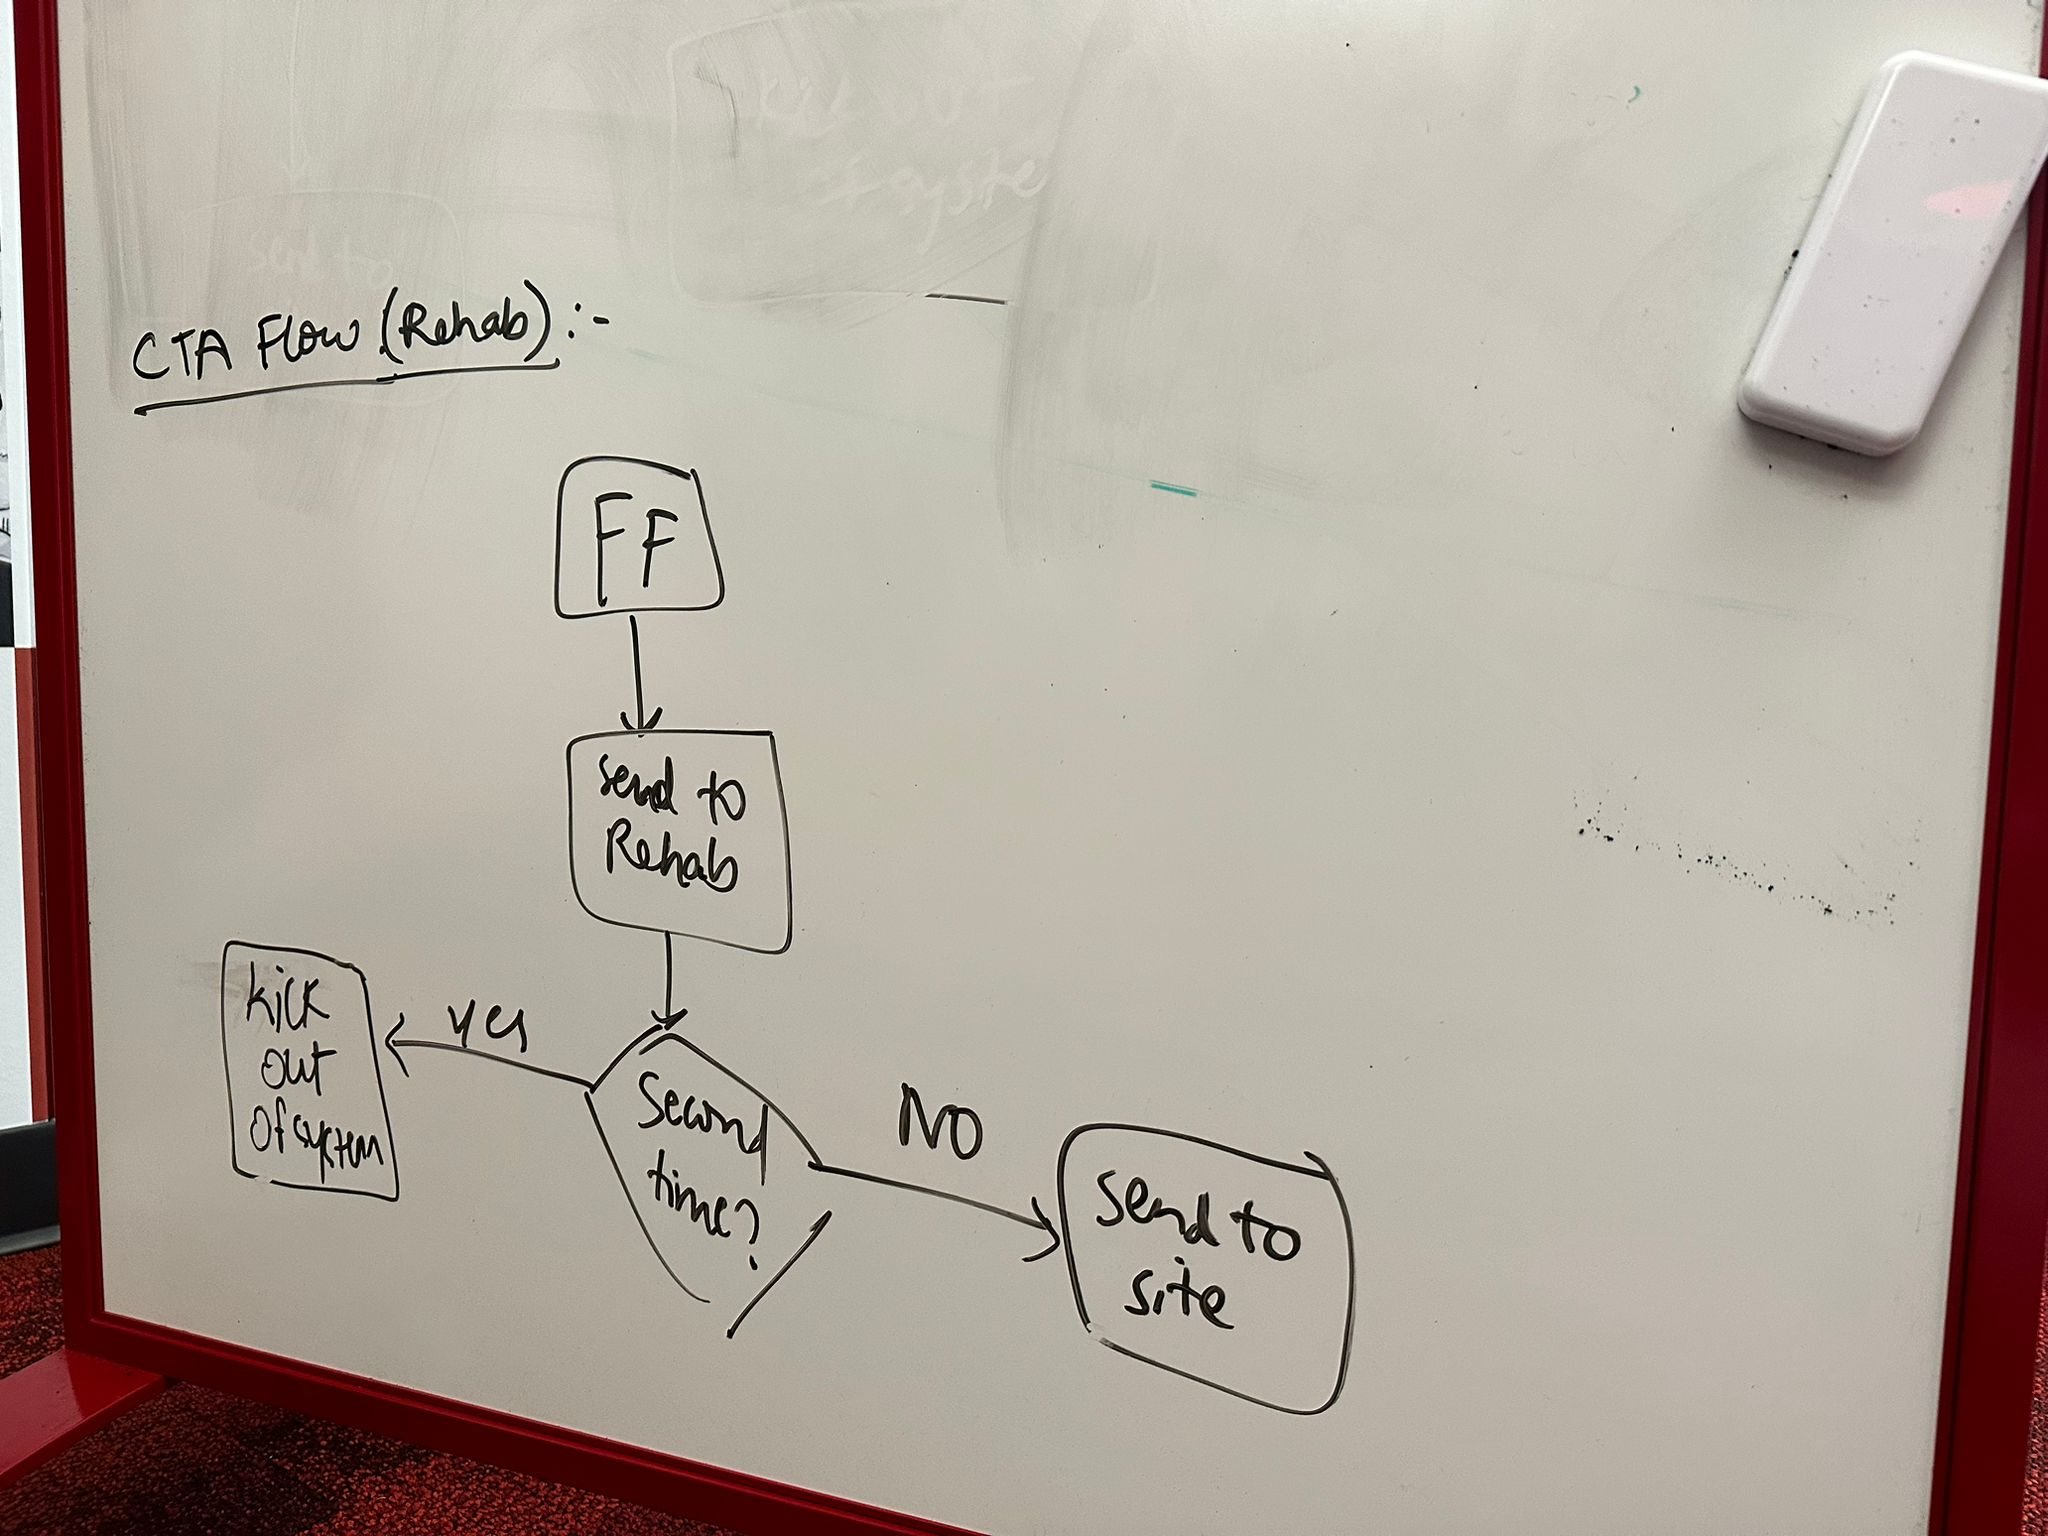
Rehab became its own In Rehab tab. Send to rehab sits on each card beside View details. In rehab, the bar turns green as someone recovers and the action becomes Send to site.
- Why it matters
The commander moves from recognising risk to acting on it without leaving the flow, and can always see who is where.
The outcome
Ascent went on to ship readiness as a decision flow rather than another dashboard: recognise risk, review the context, act. These are the signals I have from before launch.
- Pre-launch
4.2 / 5
Prototype satisfaction
- Pre-launch
82
System Usability Scale (SUS) score
- Scope check
85%
Of the original research themes mapped to a launch-scope fix
Reflection
In high-pressure systems, clarity is a form of care.
The work was less about showing every signal and more about helping a team notice the right evidence, understand the context, and act without losing time to interpretation.